Though nonprime loan portfolios increased last year, delinquency rates grew at a faster clip, according to the 2014 Non-Prime Auto Financing Survey released in late May.
The annual survey, commissioned by the National Automotive Finance Association and conducted by BenchMark Consulting International, aggregated data from 22 banks and independent finance companies. Collectively, the survey’s respondents held 1.2 million accounts worth more than $13 billion at yearend 2013.
Overall, the average nonprime portfolio last year was $630.5 million, a 9.7% increase from $574.6 million at yearend 2012. Yet as outstanding balances grew, financiers recorded worsening loan performance. After three straight years of decline, delinquencies — based on dollars, not accounts — rose 107 basis points to 6.42%.
The survey noted varying degrees of loan deterioration. For instance, delinquencies spiked more than 50%, year over year, for 27% of respondents, but rose 10% or less for another 40% of respondents.
Specifically, the 30-day delinquency rate increased 46 basis points to 3.53%; the 60-day rate rose 36 basis points to 1.53%; and the 90-day rate grew 24 basis points to 1.35%.
The net chargeoff rate increased, too — 100 basis points year over year, to 6.9%. The average repossession rate was also on the rise, 9.5% last year from 8.9% in 2012, according to the survey.
Here’s a sampling of other findings from the NAF survey:
- The average number of accounts per portfolio ticked up 5% last year to 58,326, from 55,559 in 2012.
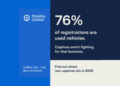
- The average amount financed on new cars was $26,943; on used cars it was $16,233.
- On new-car loans, the average credit score was 614, the average term was 70 months, the average loan-to-value ratio was 126%, and the average interest rate was 8.11%. On used-car loans, the respective data points were: 596 credit score, 60 months, 141% LTV, and 12.96% interest.
- Respondents purchased contracts, on average, at 92.7% of face value in 2013, compared with 92.2% in 2012. In other words, discounts fell to 7.3% from 7.8%.
- The average cost to process an application was $16, while the average cost to fund a contract was $87.
- Profits fell 14% to 5.2% in 2013, while the average cost of funds remained unchanged at 3.8%.
- Only 14% of survey participants employed e-contracting last year.
- Aside from telephone communications, 65% of survey participants serviced accounts via text messaging, up from 50% in 2012.