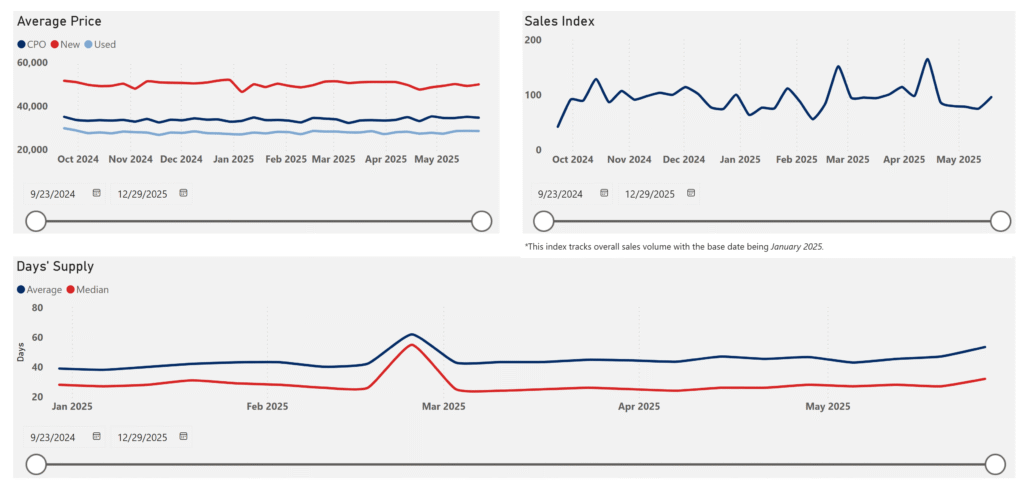
Days’ supply and average prices have held steady across new, used and certified pre-owned vehicles while sales have fluctuated during the past six months.
The average price of a new vehicle sat at $49,810 as of May 26, up 2.5% compared with April 28, according to new Big Wheels vehicle price trends data launching today. During the same period, the average price of a used car inched down 0.1% to $28,727 and for a CPO vehicle, the price dipped 1.1% to $34,965.
Inventory averaged 56.04 days’ supply industrywide as of May 26. Vehicle sales volume has shifted, with the Big Wheels sales index landing at 108.7 as of May 19 compared with 87 as of April 21and 41.7 as of September 23, 2024. The index measures overall sales volume indexed to January 2025 as a baseline, serving as a benchmark tool for how sales are performing.
The new, interactive pricing datasets are part of the revamped Big Wheels data collection, which includes peer comparison data and information on underwriting, pricing and capital trends that allow industry professionals to get a holistic view of the market and break down data across lender types, make and model and condition.
Price, inventory and sales data can be sorted by model year, body style, fuel type, make, model and condition. Most datasets are updated on a daily basis.
Average vehicle price trends
Comparing price ranges
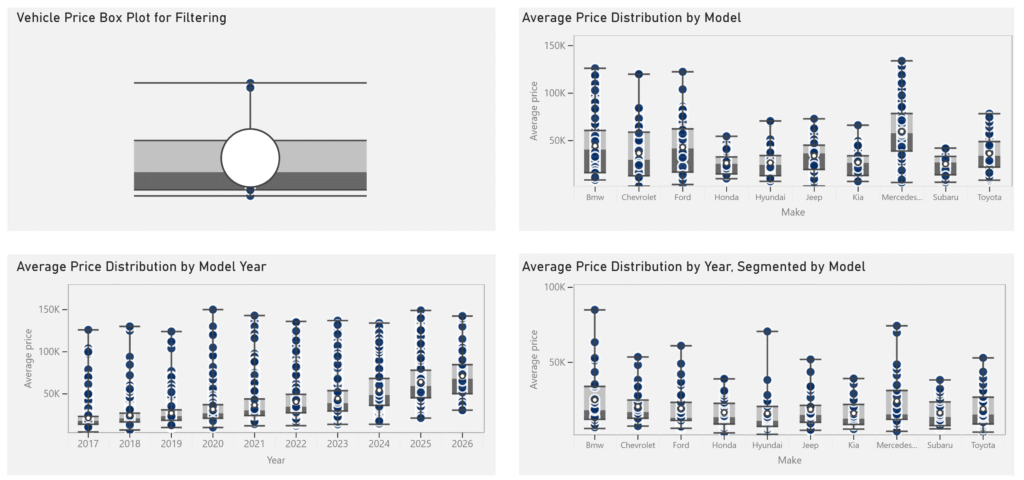
New price box plot data offers insight into how prices range and compare across specific brands, models and makes and model year. Distribution information by model and make allows for a comparison of price ranges across brands and specific models, while model year distributions show pricing trends by production year to support residual value analysis.
For example, prices by vehicle model year show that newer vehicles generally cluster within a higher price range while older models have more variation and drop-offs in price. The data can be used to determine depreciation patterns and how price dispersion widens over time, useful for residual value forecasts.
Cluster boxes on the plots reflect 50% of the vehicles that fall within the median price range. For example, the cluster for Honda vehicles that are model year 2025 or 2026 was concentrated at higher prices compared with older model years, based on data within the past 30 days.
Vehicle price box-plots
Price vs mileage
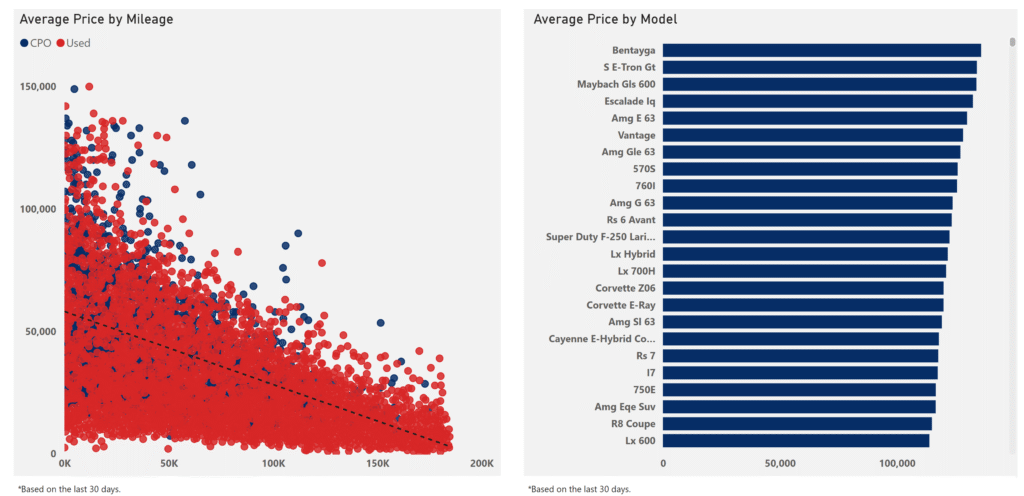
Newly added vehicle price by mileage data shows the relationship between average price and mileage, typically reflecting that the higher the mileage, the lower the vehicle price, segmented by condition such as used versus CPO. The data is helpful to assess depreciation curves, calibrate loan-to-value strategies, or flag models for GAP coverage or tighter loan terms.
Vehicle price by mileage
Additionally, vehicle price distribution data tracks the share of sales by condition, including broken down by mileage to show how they affect used and CPO sales. Price information also highlights brands that have the largest gains or declines in average vehicle price compared with 2024. The data can be filtered to highlight specific fuel types, make and models, model year and condition.
Vehicle price distribution
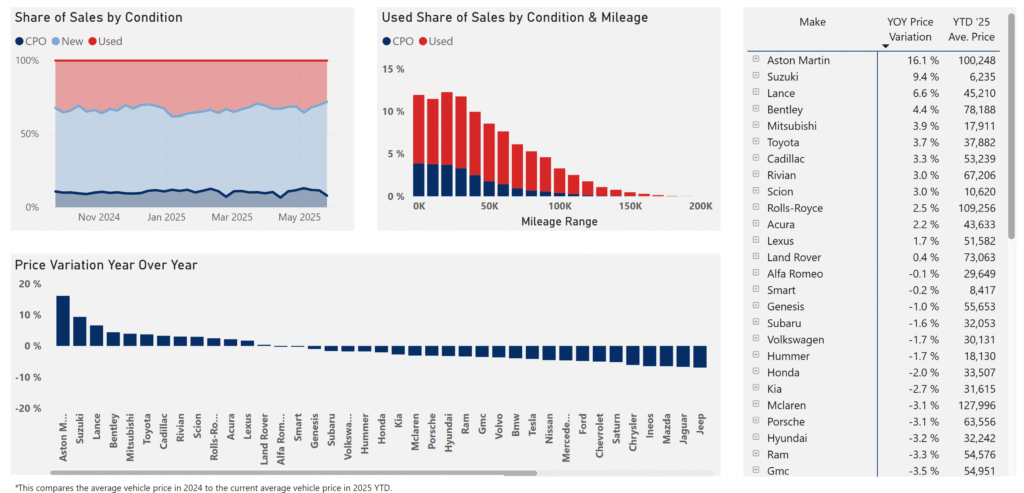
For example, Aston Martin had the largest year over year price variation year to date in 2025 compared with 2024 at 16.6%. New vehicles made up the largest share of sales by condition at 64% compared with used at 28.3% and CPO at 7.7%.
Along with new data on pricing, Auto Finance News this month released the 2025 Big Wheels Rankings data along with the launch of five new interactive dashboards diving into peer comparisons.
Big Wheels Auto Finance Data supports strategic planning, portfolio growth and risk management. Access all data here.